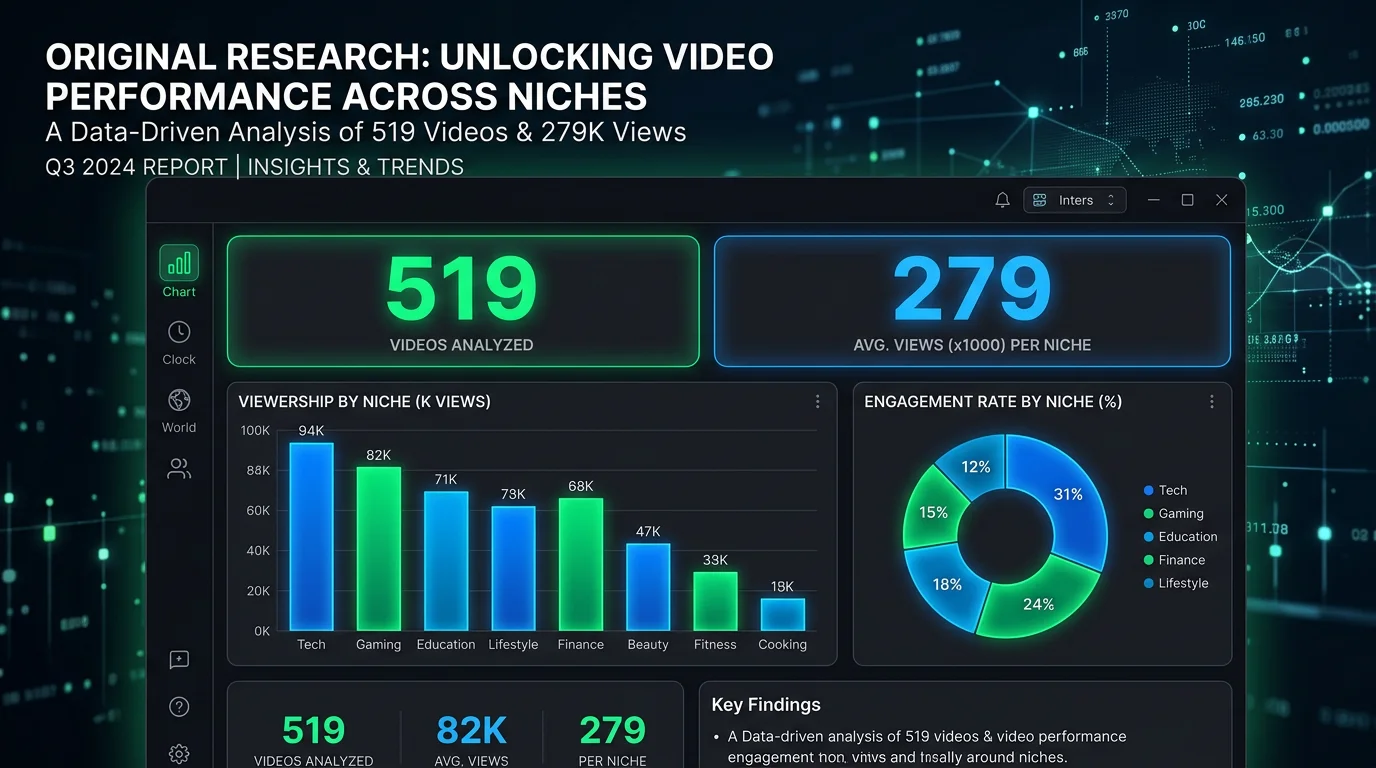
We Analyzed 519 AI-Generated Videos: Here's What Actually Works
We analyzed 519 videos generated by FlowShorts across 13 niches, 279 creators, and 3 platforms. Here's the real data on which niches perform best, posting patterns, platform adoption, and where the pipeline fails.
FlowShorts Team
We have a unique vantage point at FlowShorts: every video generated on our platform gives us data on what niches creators choose, which platforms they post to, how often videos succeed vs fail, and what patterns separate active creators from those who churn.
We analyzed 519 videos generated across 279 creators from February-April 2026. Here's what the data shows — no fluff, just numbers.
The Dataset
| Metric | Value |
|---|---|
| Total videos generated | 519 |
| Successfully posted | 362 (69.7%) |
| Failed generations | 17 (3.3%) |
| Unique creators | 279 |
| Time period | Feb 12 – Apr 12, 2026 (59 days) |
| Platforms connected | YouTube (138), TikTok (75), Instagram (25) |
Finding #1: History Is the Surprising Winner
When we ranked niches by post success rate (% of generated videos that actually get posted to social platforms), the results surprised us:
| Niche | Videos | Posted | Post Rate | Verdict |
|---|---|---|---|---|
| History | 62 | 55 | 88.7% | Highest completion — creators stick with it |
| Finance | 25 | 21 | 84.0% | High-value niche, committed creators |
| Mysteries | 32 | 25 | 78.1% | Strong engagement niche |
| Motivation | 21 | 15 | 71.4% | Popular but lower follow-through |
| Technology | 22 | 15 | 68.2% | Mid-range completion |
| Facts | 19 | 11 | 57.9% | Lower — possibly too generic |
Why History wins: History content has built-in narrative structure — every video tells a story with a beginning, middle, and end. This means scripts are consistently engaging, and creators are more satisfied with the output. Finance ranks second because creators in that niche are typically more committed (they're building a business, not experimenting).
Why Facts and Motivation underperform: These niches are more generic — "interesting facts" and "motivational quotes" produce less distinctive content, which may lead to lower creator satisfaction and less follow-through on posting.
Finding #2: 55% of Creators Use Custom Topics
We offer 13 preset niches, but the data shows creators overwhelmingly prefer custom topics:
| Topic Type | Users | % of Total |
|---|---|---|
| Custom topic (user writes their own) | 231 | 55% |
| Preset category (picks from our 13) | 143 | 34% |
| Not set (abandoned before choosing) | 46 | 11% |
What this means: Creators want to define their own niche, not pick from a menu. The most common custom topics include religious content, specific historical periods, niche sports, relationship advice, and hyper-specific sub-niches within our preset categories (e.g., "stoicism" instead of "philosophy").
Create Faceless Videos on Autopilot
FlowShorts generates and posts AI videos to YouTube, TikTok & Instagram while you sleep.
Try FlowShorts Free →For creators: Don't feel limited to broad niches. The more specific your topic, the more differentiated your content. "Roman military tactics" will outperform "history facts" because it attracts a dedicated audience.
Finding #3: YouTube Dominates, Instagram Lags
Platform adoption among FlowShorts creators:
| Platform | Creators Connected | % of Users |
|---|---|---|
| YouTube | 138 | 57% |
| TikTok | 75 | 31% |
| 25 | 10% |
YouTube is the primary platform for faceless AI video creators — nearly 6x more popular than Instagram. This aligns with the monetization data: YouTube Shorts has the most reliable revenue sharing program, while Instagram's monetization options are less mature.
Instagram is underutilized. Only 10% of creators connect Instagram despite Reels having massive reach potential. This is likely because Instagram's faceless content culture is less established than YouTube's and TikTok's. It's an opportunity — less competition on Instagram means easier growth for early movers.
For creators: If you're only posting to YouTube, you're missing 2 additional platforms with zero extra effort. Cross-posting the same video to all 3 triples your distribution.
Finding #4: Wednesday Is the Busiest Video Day
Videos generated by day of week:
| Day | Videos Generated | Posted | Post Rate |
|---|---|---|---|
| Monday | 68 | 53 | 77.9% |
| Tuesday | 80 | 62 | 77.5% |
| Wednesday | 92 | 54 | 58.7% |
| Thursday | 81 | 51 | 63.0% |
| Friday | 69 | 53 | 76.8% |
| Saturday | 54 | 44 | 81.5% |
| Sunday | 75 | 45 | 60.0% |
Interesting pattern: Wednesday has the most video generations but the lowest post rate (58.7%). Saturday has the fewest generations but the highest post rate (81.5%).
Our theory: Wednesday is when people try the platform (sign up, generate a test video) but don't follow through with posting. Saturday users are more deliberate — they've already set up their accounts and are genuinely creating content. The mid-week spike is exploratory; the weekend posting is intentional.
Create Faceless Videos on Autopilot
FlowShorts generates and posts AI videos to YouTube, TikTok & Instagram while you sleep.
Try FlowShorts Free →Finding #5: 76% of Failures Happen at Rendering
Of the 17 failed video generations (3.3% failure rate), the failure breakdown is:
| Stage | Failures | % of Failures |
|---|---|---|
| Remotion rendering | 13 | 76.5% |
| Script generation | 4 | 23.5% |
The rendering stage (where all elements — images, voiceover, captions, music — are composited into the final video) is the most complex step and the most likely to fail. We're actively working on improving rendering reliability.
Notably, image generation, voiceover, and caption generation have 0% failure rates. The AI content creation pipeline is reliable — it's the final video assembly that occasionally fails.
Finding #6: The Average Creator Makes 1.86 Videos
519 videos ÷ 279 creators = 1.86 videos per creator. This tells a clear story:
- Most creators generate 1 free video and don't continue
- A small percentage of power users generate 10-30+ videos each
- The distribution is heavily skewed — a few committed creators account for most of the video volume
This matches the broader creator economy pattern: most people try, few persist, and those who persist disproportionately succeed. The 3% of YouTube channels that reach monetization aren't more talented — they're more consistent.
Key Takeaways for Creators
- Pick a specific niche, not a broad category. Custom topics outperform preset categories. "Roman military tactics" beats "history facts."
- History and finance have the highest follow-through. If you're choosing a niche for the first time, narrative-driven niches produce more consistently satisfying content.
- Post to all 3 platforms. Only 10% of our creators use Instagram despite it being included. Free reach you're leaving on the table.
- Weekend creators are more committed. If you're exploring, take time to properly set up your accounts before generating. Deliberate creators have 80%+ post rates vs 58% for mid-week browsers.
- The bottleneck is consistency, not quality. At 1.86 videos per creator average, most people never give the platform (or themselves) enough time to see results. The creators who succeed are the ones who keep posting.
Methodology
Data sourced from the FlowShorts platform database, covering all video generation events from February 12 to April 12, 2026. All data is anonymized — no individual creator data is identifiable. "Posted" means the video was successfully published to at least one connected social platform. "Failed" means the generation pipeline encountered an error before completion.