YouTube Analytics Explained: Every Metric Creators Need to Understand (2026)
Complete guide to YouTube Analytics. Understand impressions, CTR, watch time, AVD, retention curves, traffic sources, Shorts analytics, and revenue metrics with actionable benchmarks.
FlowShorts Team
YouTube Analytics tells you exactly what's working and what isn't on your channel. The problem is that most creators glance at view counts and ignore the metrics that actually drive growth — impressions CTR, average view duration, traffic sources, and audience retention curves.
This guide breaks down every metric in YouTube Studio, explains what each one means in plain language, and tells you what action to take based on the numbers you see.
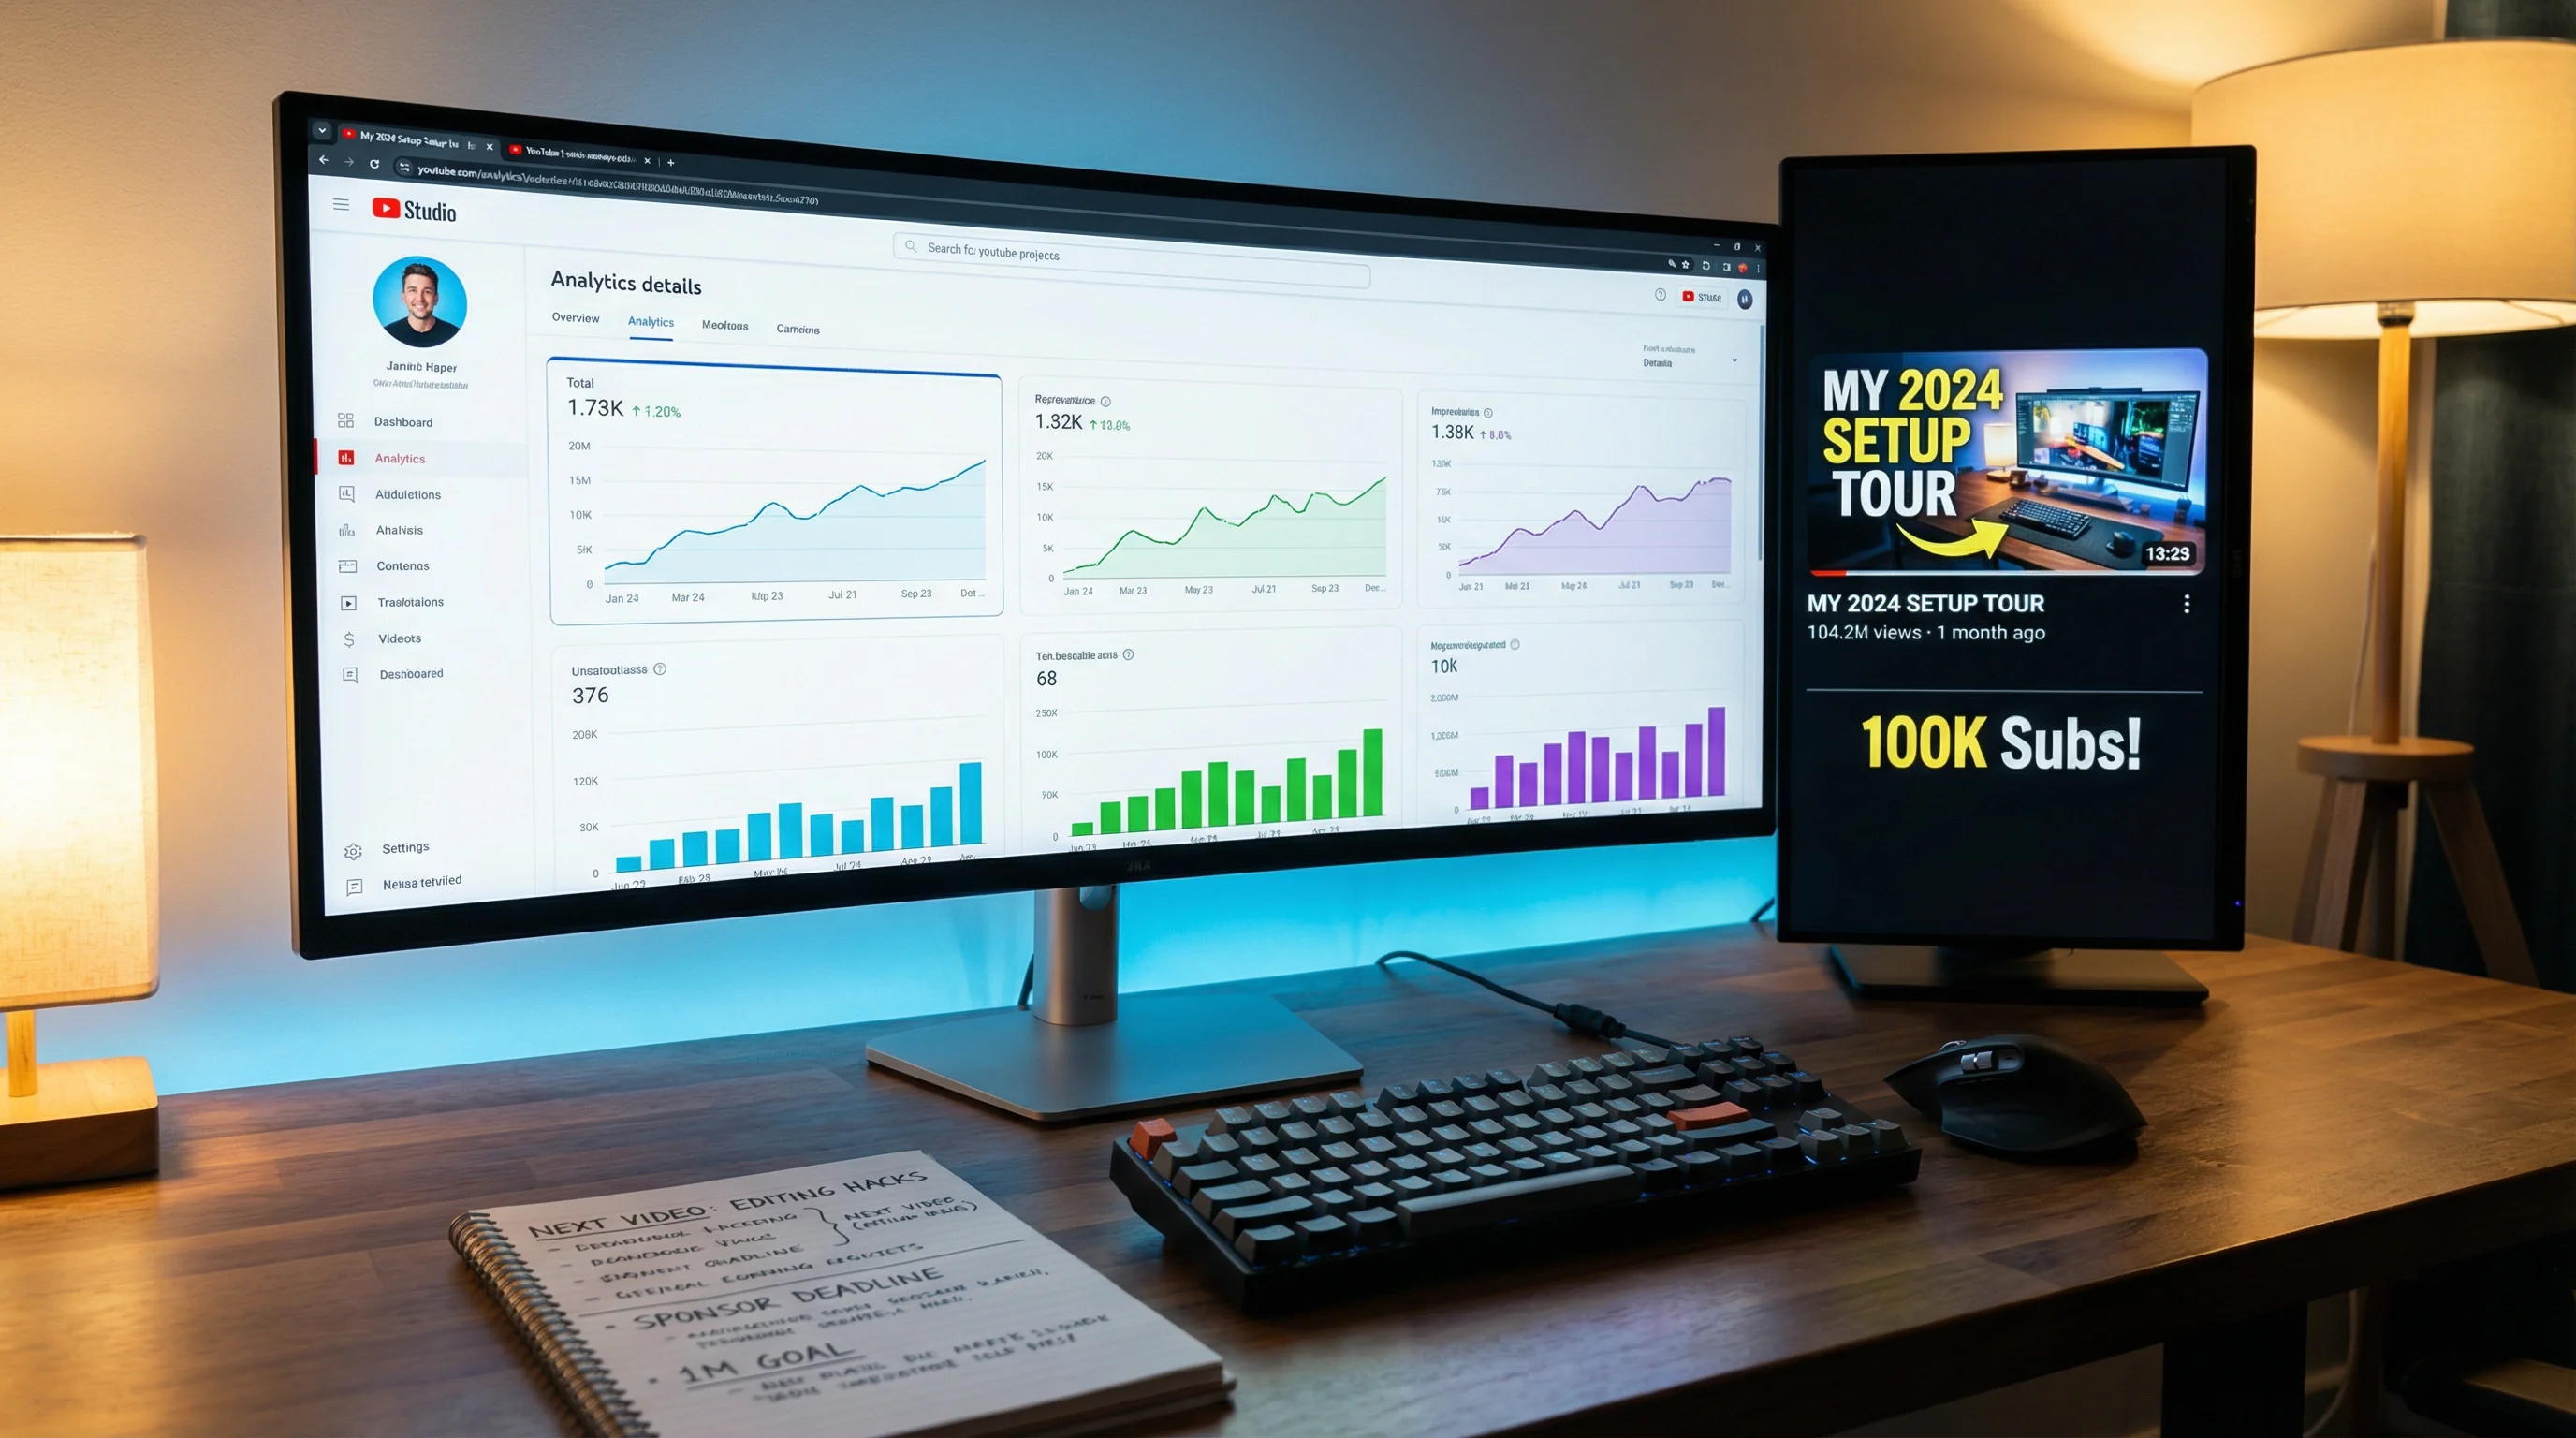
How to Access YouTube Analytics
- Go to studio.youtube.com
- Click Analytics in the left sidebar
- You'll see four tabs: Overview, Content, Audience, and Revenue (if monetized)
You can also view analytics for individual videos by clicking Content in the sidebar, selecting a video, and clicking Analytics.
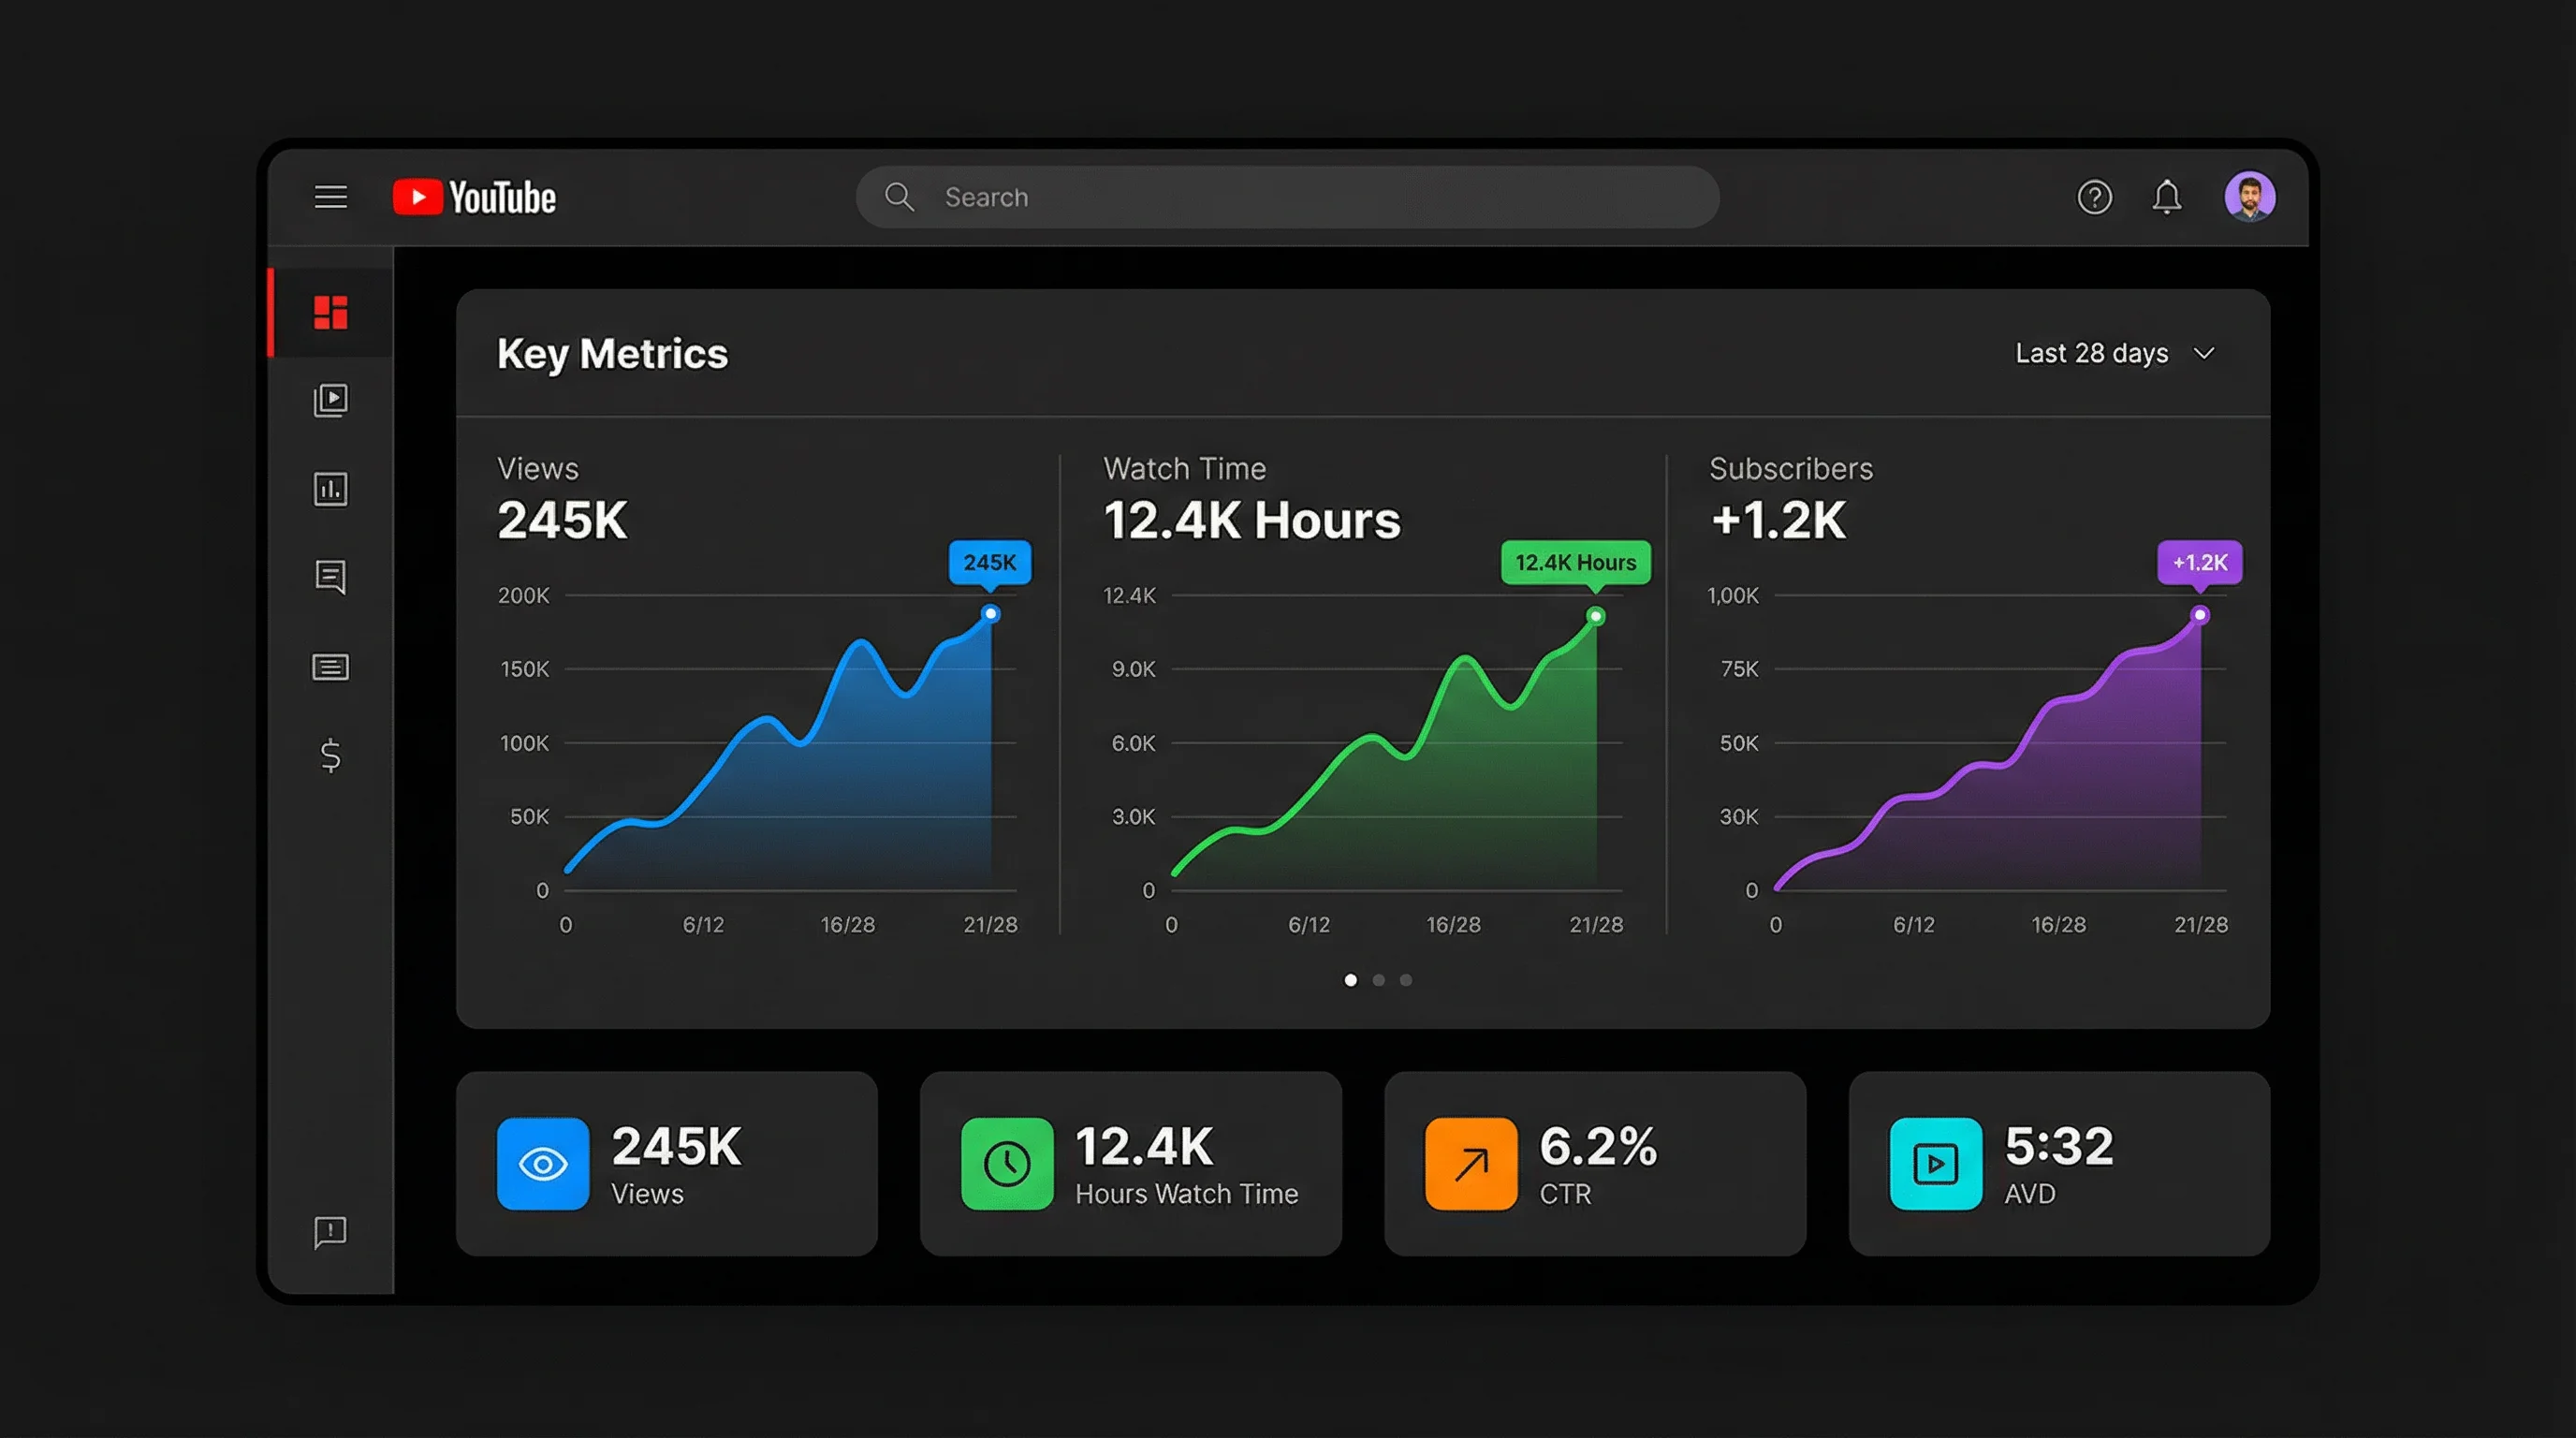
The Metrics That Matter Most
YouTube tracks dozens of metrics. These are the ones that directly impact your channel's growth and revenue.
Impressions
An impression is counted every time your thumbnail is shown to a viewer — in search results, the homepage feed, suggested videos, or the Shorts shelf. Impressions tell you how often YouTube is showing your content.
What to watch: If impressions are rising over time, YouTube is distributing your content more broadly. If impressions drop, the algorithm has slowed distribution — usually because recent videos had lower engagement.
Action: You can't directly control impressions. They're a downstream result of CTR and watch time on your recent videos. Focus on those metrics, and impressions will follow.
Impressions Click-Through Rate (CTR)
CTR is the percentage of impressions that result in a click — someone saw your thumbnail and decided to watch. This is the single most actionable metric for most creators.
| CTR Range | Assessment | Action |
|---|---|---|
| 2–4% | Below average | Redesign thumbnails and rewrite titles. Test bolder visuals, stronger hooks, or more curiosity-driven framing. |
| 4–7% | Average | Solid foundation. Test small variations — different facial expressions, text placement, color schemes — to push higher. |
| 7–10% | Good | Your thumbnails and titles are working. Focus on maintaining this through A/B testing and consistent style. |
| 10%+ | Excellent | Exceptional performance. Study what makes these videos click and apply the pattern to future content. |
Note: CTR typically drops as impressions increase. A video with 100 impressions might have 15% CTR, but as YouTube shows it to broader, less targeted audiences, CTR naturally falls to 5-7%. This is normal and expected.
Better thumbnails directly improve CTR. See our YouTube thumbnail size and design guide for best practices.
Average View Duration (AVD)
AVD tells you how long viewers watch your video on average. It's the primary signal YouTube uses to judge content quality. A 10-minute video with 6 minutes AVD (60% retention) is a strong performer. A 10-minute video with 2 minutes AVD (20% retention) tells YouTube viewers aren't finding value.
| Retention % | Assessment | Action |
|---|---|---|
| Under 30% | Poor | Your content loses viewers early. Improve your hook (first 30 seconds) and tighten pacing throughout. |
| 30–50% | Average | Viewers are engaged but dropping off mid-video. Look at the retention graph to find exact drop-off points. |
| 50–70% | Good | Strong retention. Most successful long-form videos fall in this range. |
| 70%+ | Excellent | Exceptional. Common for well-edited Shorts and highly engaging long-form content. |
For tips on keeping viewers watching, see our 50 video editing tips — especially the pacing and hook sections.
Watch Time
Total minutes viewers spent watching your content. Watch time is cumulative — every minute from every viewer adds up. This metric matters for two reasons:
- Algorithm ranking: Videos with more watch time get promoted more broadly
- Monetization: You need 4,000 watch hours in 12 months to qualify for the YouTube Partner Program
Action: Watch time = views × AVD. To increase watch time, either get more views (improve CTR/distribution) or keep viewers watching longer (improve retention). Long-form content generates watch time much faster than Shorts per view.
Subscribers Gained vs. Lost
Create Faceless Videos on Autopilot
FlowShorts generates and posts AI videos to YouTube, TikTok & Instagram while you sleep.
Try FlowShorts Free →Shows how many subscribers you gained and lost in a given period, and which videos drove the most subscriptions. A video that gains many subscribers relative to its views has a high "subscribe rate" — this signals to YouTube that your content converts viewers into committed fans.
Action: Identify your top subscriber-driving videos and make more content like them. Add a clear subscribe CTA to every video. YouTube Shorts are particularly effective for subscriber growth — one viral Short can deliver hundreds of new subscribers.
Traffic Sources: Where Your Views Come From
The Traffic Sources report shows you exactly how viewers found your videos. Each source represents a different discovery mechanism:
| Traffic Source | What It Means | How to Grow It |
|---|---|---|
| YouTube Search | Viewers typed a query and found your video | Optimize titles, descriptions, and tags for target keywords. Use our Title Generator and Description Generator. |
| Suggested Videos | YouTube recommended your video alongside or after another video | Create content related to popular videos in your niche. Strong CTR and retention drive more suggestions. |
| Browse Features | Your video appeared on the homepage or subscription feed | Consistent uploads and high engagement on recent videos increase homepage placement. |
| Shorts Feed | Your Short appeared in the Shorts scrolling feed | Post Shorts consistently. Hook in the first second. Use trending topics. |
| External | Traffic from websites, social media, or messaging apps | Share videos on relevant platforms. Embed in blog posts. Post clips on TikTok/Instagram with links. |
| Playlists | Viewed as part of a playlist (yours or someone else's) | Create playlists grouping related videos. Add your videos to others' collaborative playlists. |
What to prioritize: For new channels, YouTube Search is usually the most reliable traffic source — you're targeting specific queries with less competition. As your channel grows, Suggested Videos and Browse Features become larger sources. Shorts Feed is its own growth engine separate from long-form.
Audience Retention Graph
The audience retention graph is the most underrated tool in YouTube Analytics. It shows a second-by-second curve of what percentage of viewers are still watching at each point in your video.
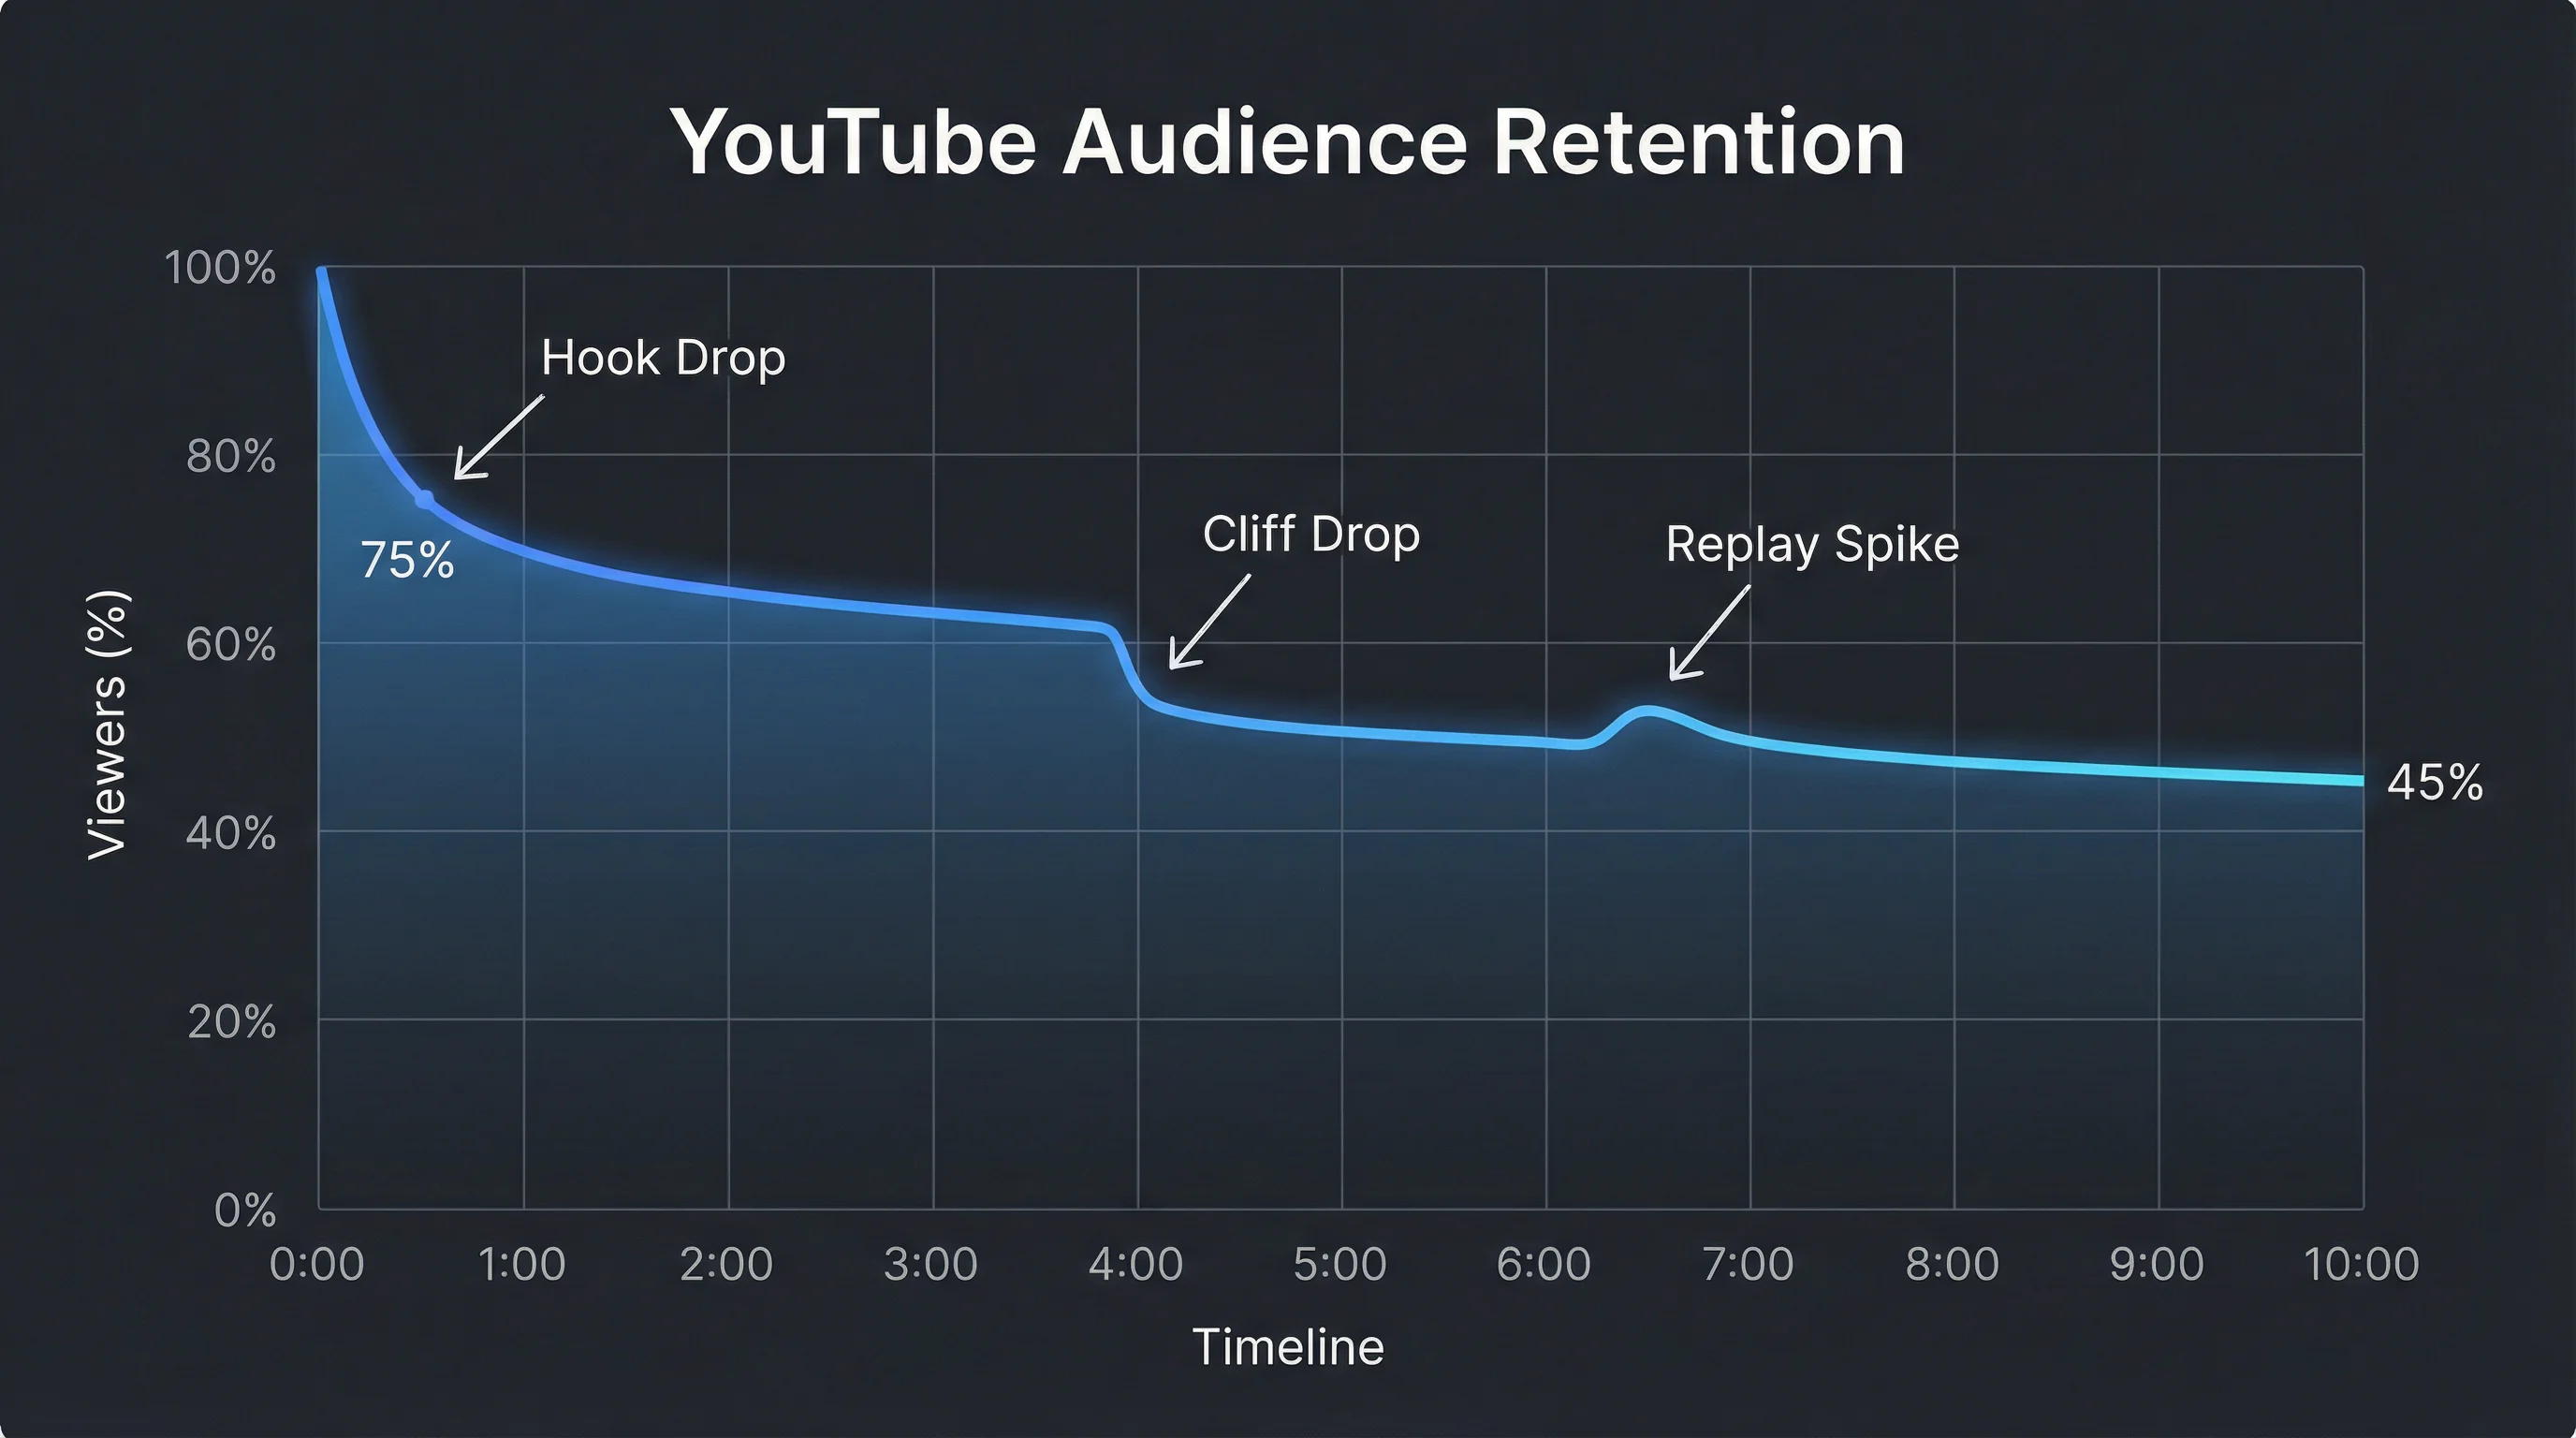
How to Read the Retention Graph
- Sharp drop in the first 30 seconds: Your hook isn't working. Viewers are deciding within seconds that the video isn't for them. Fix: Lead with value, not introductions.
- Gradual steady decline: Normal and expected. A smooth downward slope means viewers are leaving at a natural rate.
- Sudden cliff drop: Something at that timestamp caused mass exit. Watch your video at that exact point — is there a boring section, a topic shift, or a pacing problem?
- Flat sections: Viewers are staying. Whatever you're doing in these sections is working — more of that.
- Spikes (upward bumps): Viewers are replaying this section. Usually means something interesting, confusing, or rewatchable happens here.
Action: Check the retention graph for every video. Identify what causes drops and what keeps viewers engaged. Apply those patterns to future videos.
YouTube Shorts Analytics
Shorts have their own analytics section in YouTube Studio. The metrics differ slightly from long-form:
Key Shorts Metrics
| Metric | What It Measures | Good Benchmark |
|---|---|---|
| Views | Times the Short was watched (including replays) | Varies widely — focus on trend, not absolute numbers |
| Likes | Engagement signal | 3-8% like rate is healthy |
| Average % viewed | How much of the Short viewers watched on average | 70%+ is strong; 100%+ means replays |
| Subscribers from Short | People who subscribed after watching | Any positive number is good — Shorts are subscriber magnets |
| Swipe away rate | % of viewers who swiped to the next Short | Lower is better — under 50% is strong |
The most important Shorts metric is average % viewed. Shorts that get watched fully (or replayed) get pushed to far more viewers. A 30-second Short with 110% average viewed (meaning most viewers watch it plus replay part of it) will massively outperform a 60-second Short with 40% average viewed.
For Shorts creation and scheduling strategies, see our guides on how many Shorts to post per day and best time to post YouTube Shorts.
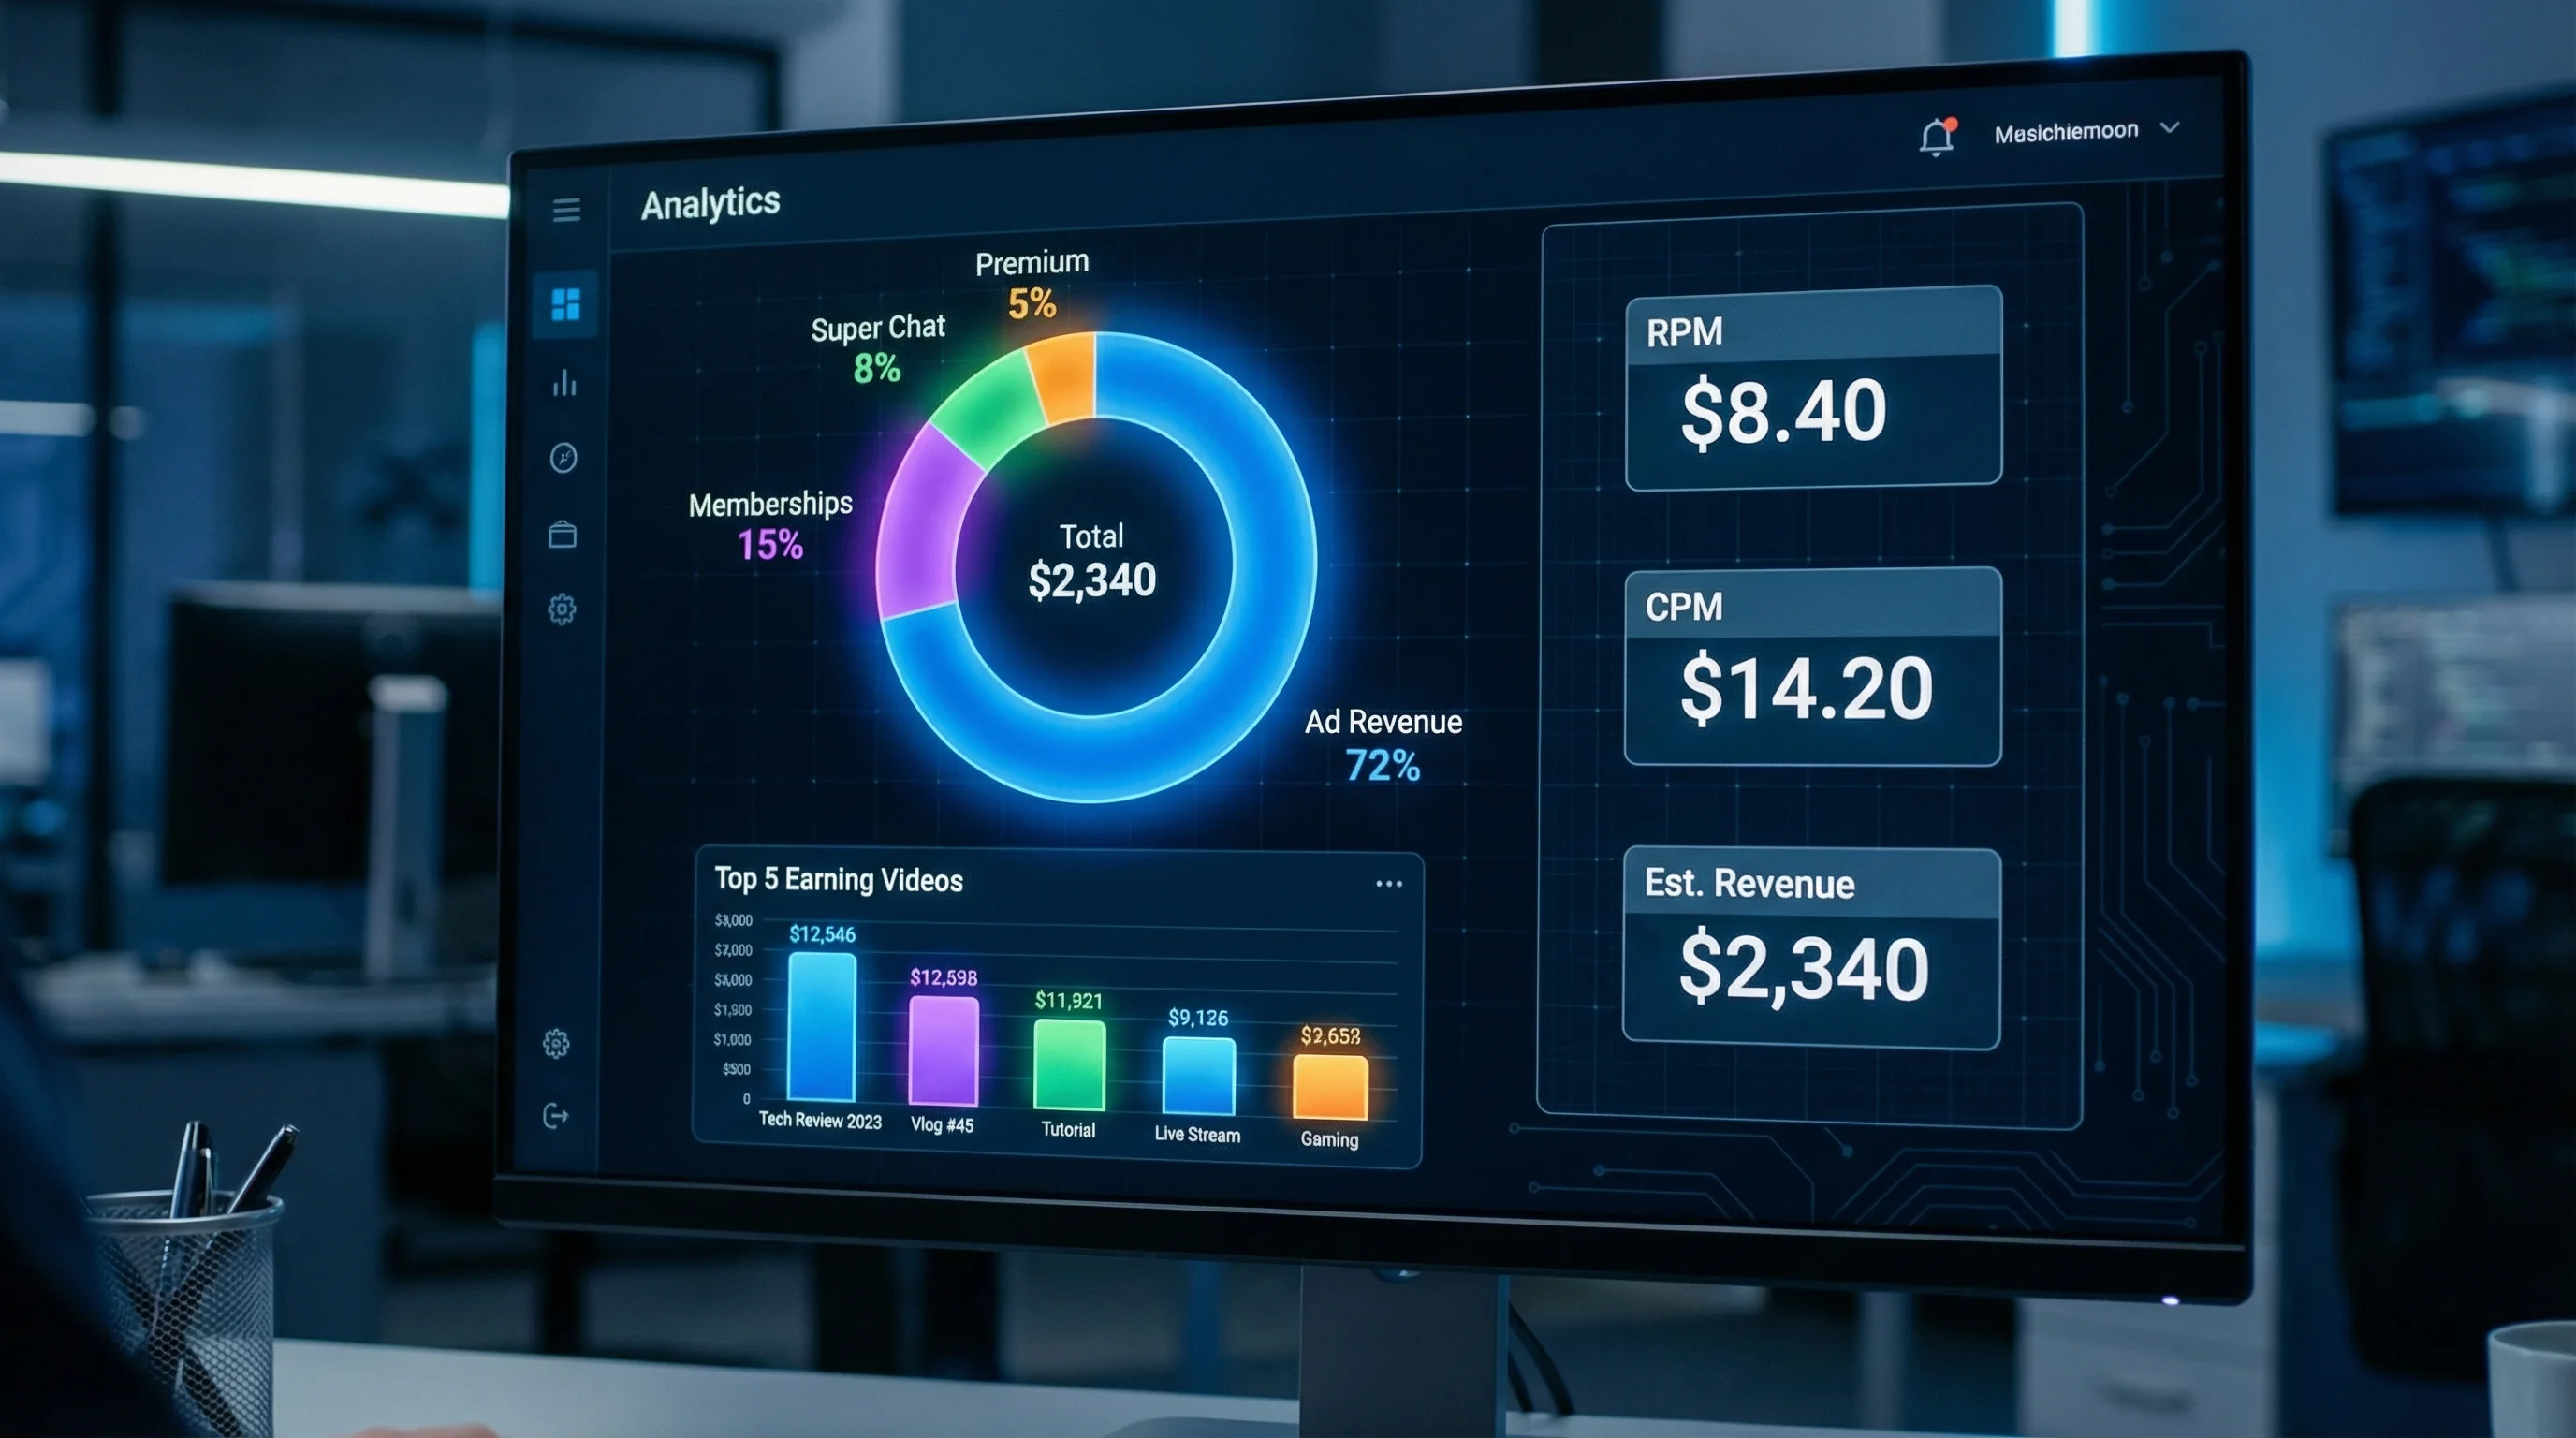
Revenue Analytics (Monetized Channels)
If you're in the YouTube Partner Program, the Revenue tab shows:
RPM (Revenue Per Mille)
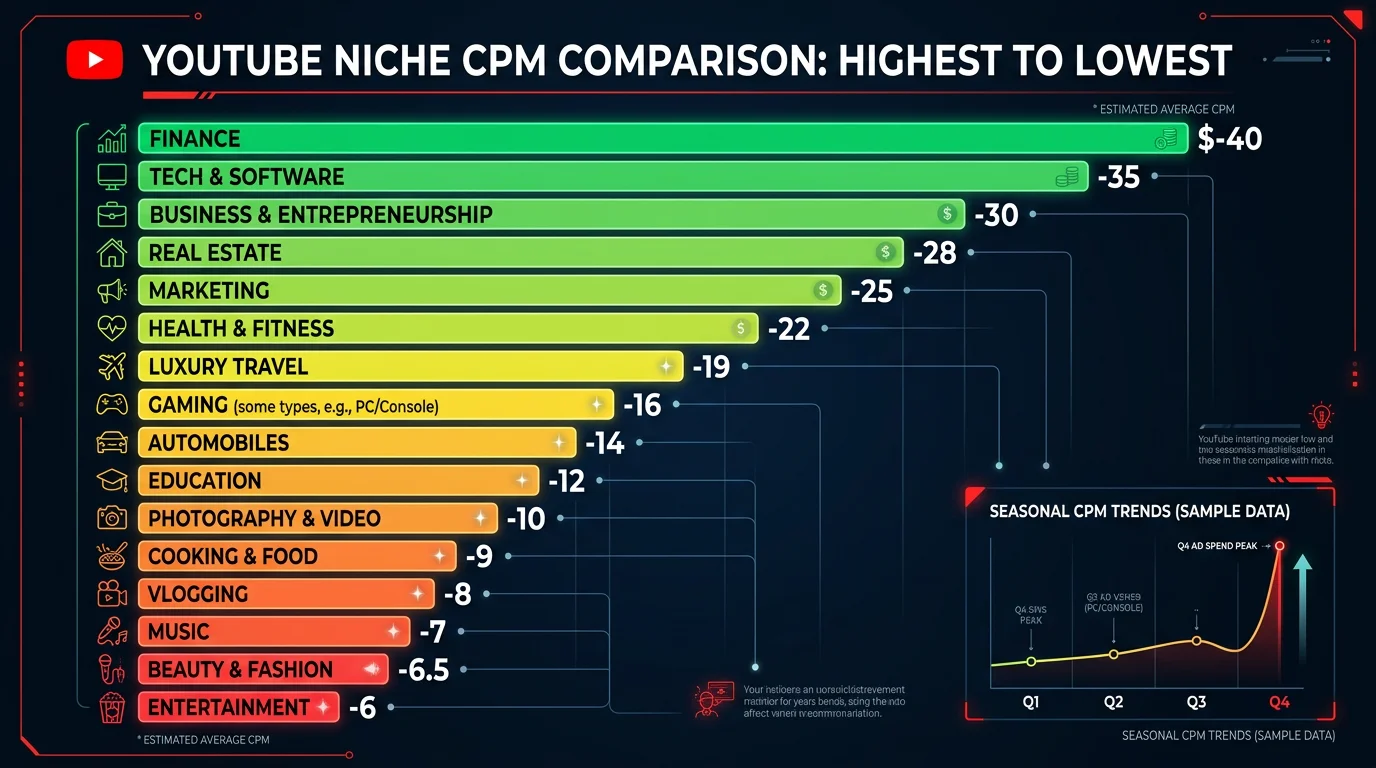
How much you earn per 1,000 views across all views, including non-monetized views. This is your real earning rate. RPM varies by niche from $1 to $30+. Use our YouTube RPM Calculator to compare your RPM against niche benchmarks.
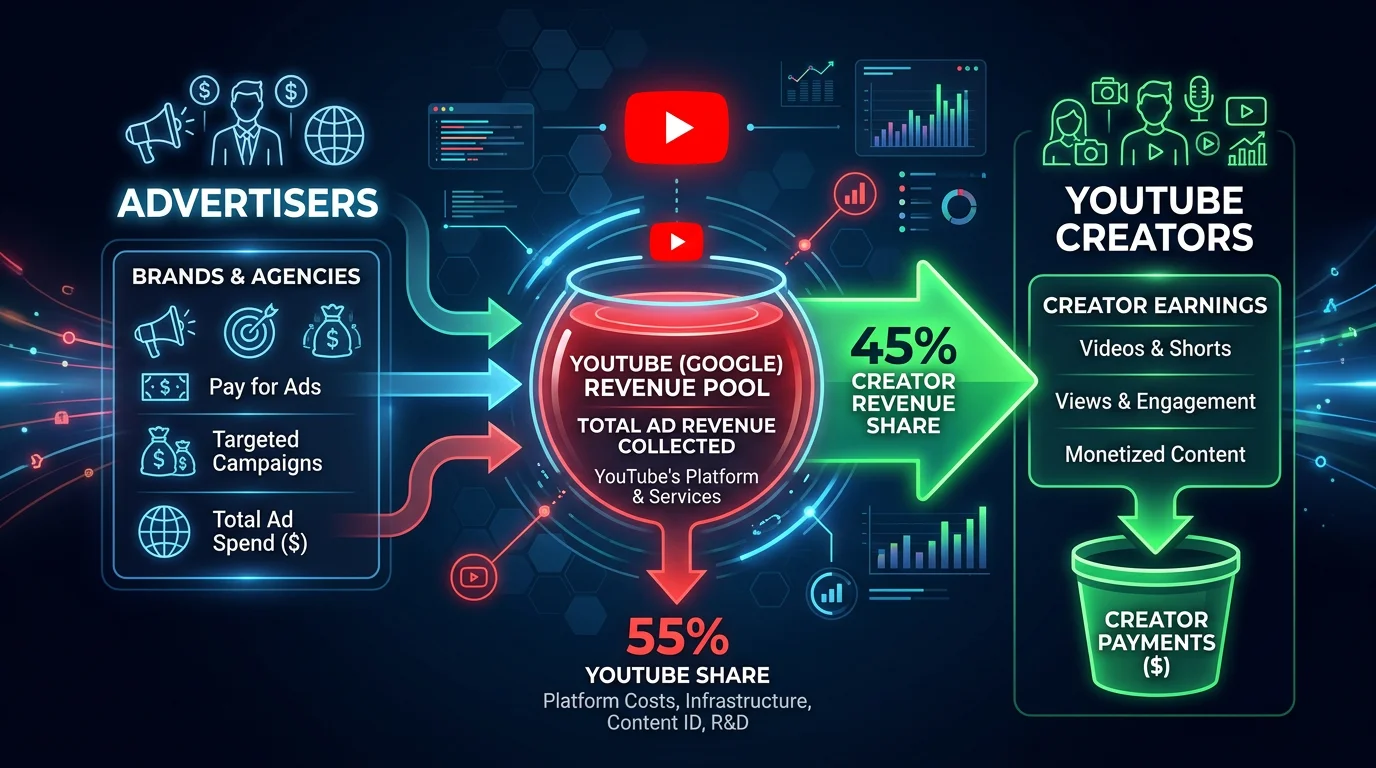
CPM (Cost Per Mille)
How much advertisers pay per 1,000 ad impressions (not video views). CPM is always higher than RPM because not every view generates an ad impression, and YouTube takes 45%. Use our YouTube CPM Calculator for niche-specific data.
Estimated Revenue
Total earnings for the selected period from all sources: ads, memberships, Super Chat, and YouTube Premium. This is pre-tax, pre-fee revenue.
Create Faceless Videos on Autopilot
FlowShorts generates and posts AI videos to YouTube, TikTok & Instagram while you sleep.
Try FlowShorts Free →Revenue Per Video
Shows which individual videos earn the most. Use this to identify your highest-earning content types and make more of them. Estimate future earnings with our YouTube Money Calculator.
Audience Analytics
The Audience tab reveals who your viewers are:
- Returning vs. new viewers: A healthy channel has a growing base of returning viewers (loyal audience) plus consistent new viewer discovery.
- Unique viewers: How many individual people watched your content. One person watching 5 videos = 5 views but 1 unique viewer.
- When your viewers are on YouTube: A heatmap showing the days and hours your specific audience is most active. Use this to schedule uploads. See our guide on best time to post YouTube Shorts.
- Age, gender, geography: Demographics that inform your content strategy and explain RPM variations (US viewers generate higher ad revenue than viewers in developing markets).
- Other channels your audience watches: Gold for understanding your competitive landscape and finding collaboration opportunities.
How to Use Analytics to Grow Faster
The Weekly Analytics Review (10 Minutes)
Every week, check these five things:
- Which video had the highest CTR this week? → Study its thumbnail and title. Apply the pattern to your next video.
- Which video had the highest AVD? → Study its structure and pacing. What kept viewers watching?
- What's your top traffic source? → If Search is dominant, keep targeting keywords. If Shorts feed is growing, double down on Shorts volume.
- Are subscribers trending up or flat? → If flat, your content isn't converting viewers to subscribers. Add stronger CTAs.
- Check the retention graph of your worst-performing video. → Find the drop-off point. Learn from it.
This 10-minute weekly habit produces more growth than hours of random content creation.
Analytics-Driven Content Decisions
| If You See... | It Means... | Do This |
|---|---|---|
| High impressions, low CTR | YouTube is showing your video, but people aren't clicking | Fix your thumbnail and title |
| High CTR, low AVD | People click but don't stay — the video doesn't deliver on the thumbnail's promise | Improve content quality, pacing, or match content to the title better |
| High AVD, low impressions | Great content that YouTube isn't distributing widely yet | Be patient — YouTube tests slowly. Share the video externally to seed initial engagement. |
| Shorts: high swipe-away rate | Your hook isn't stopping the scroll | Redesign the first frame. Use our Video Hook Generator. |
| Subscribers declining | Recent content isn't matching what your subscribers expect | Review what content gained subscribers and return to that format |
Frequently Asked Questions
How do I access YouTube Analytics?
Go to studio.youtube.com and click Analytics in the left sidebar. You can also access it from the YouTube mobile app under your profile → YouTube Studio → Analytics.
What is a good CTR on YouTube?
4-7% is average across YouTube. Above 7% is good, above 10% is excellent. CTR naturally drops as a video reaches broader audiences. A video's CTR in its first 48 hours is the most important window — that's when YouTube decides how aggressively to promote it.
What is a good average view duration?
Aim for 50%+ retention on long-form videos and 70%+ on Shorts. A 10-minute video with 5+ minutes AVD is performing well. The absolute number matters less than how your AVD compares to similar-length videos in your niche.
What's the difference between RPM and CPM?
RPM = your actual earnings per 1,000 total views (including non-monetized views). CPM = what advertisers pay per 1,000 ad impressions. CPM is always higher than RPM because not every view shows an ad, and YouTube takes 45% of ad revenue.
Can I see analytics for YouTube Shorts?
Yes. In YouTube Studio, go to Analytics → Content tab. You can filter by "Shorts" to see Shorts-specific metrics including views, average % viewed, likes, and subscriber conversions. Individual Short analytics show swipe-away rate and traffic sources.
How often should I check YouTube Analytics?
Do a focused weekly review (10 minutes, checking CTR, AVD, traffic sources, subscriber trend, and one retention graph). Avoid checking daily — short-term fluctuations are noise. The patterns that matter emerge over weeks, not days.
Related Guides
- YouTube Partner Program Guide
- How to Get More Views on YouTube Shorts
- YouTube Thumbnail Size & Design Guide
- Best Time to Post YouTube Shorts
- How Does YouTube Count Views?
- How to Start a YouTube Channel
Grow Your Analytics With Consistent Content
Better analytics start with consistent posting. FlowShorts generates AI-powered Shorts daily — scripts, voiceover, visuals, captions — and auto-posts to YouTube, TikTok, and Instagram Reels. More content means more data, faster learning, and faster growth.
Start by niche: How to Start a YouTube Channel by Niche — step-by-step guides for 25+ niches.